Weather Data Explanations
Relative Humidity:
Humidity refers to the amount of water vapor in the air. However, the amount of water vapor that the air can contain varies with air temperature and pressure. Relative humidity takes these factors into account and presents a humidity reading which reflects the amount of water vapor in the air as a percentage of the amount the air is capable of holding at the current temperature and pressure. Relative humidity, therefore, is not actually a measure of the amount of water vapor in the air, but a ratio of the air’s water vapor content to its capacity.
It is important to realize that relative humidity changes with temperature even though the water vapor content itself may not have changed. Warm air can “hold” more water than cooler air so simply raising the temperature of an air mass will lower it’s relative humidity even though the amount of water vapor in the air has not changed. Likewise, if you continue to lower the temperature of the air while the water vapor content remains the same the relative humidity will increase. As you take the air temperature lower the relative humidity will continue to rise until it reaches 100%. At that point you have reach the “Dew Point”.
Dew Point:
A better name might be “humidity factor” because the dew point is a better indication of how much moisture is actually in the air, regardless of the temperature. Dew point is the temperature to which air must be cooled to reach 100% relative humidity (saturation) assuming no change in water vapor content. Whenever you have the air temperature near the dew point the likelihood of dew, frost or fog forming is high. Dew point is a good indicator of the air’s actual water vapor content. A high dew point indicates high water vapor content while a low dew point indicates low water vapor content. A high dew point indicates a good chance for rain.
Dew point is the most important data statistic, besides the temperature, that determines the human “comfort” factor. With the mild temperature ranges found in Waikoloa Village most people would call the air “comfortable” as long as the dew point remains below 65-70 degrees, regardless of the temperature. As the dew point nears 70 most people will start noticing the “humidity” in the air and anything above 70 will start to be “uncomfortable”. Meaning moisture may start to form on your skin and you will feel damp or clammy and the air will feel muggy. Dew points below 65 degrees are very pleasant, regardless of the temperature, because the air is “dry”.
Winds out of the west, whether simply daytime convection sea breezes due to the lack of any northeast trade winds or strong Kona Winds (winds out of the west or southwest) from a larger weather pattern, usually mean more moisture and higher dew points for Waikoloa Village. Higher dew points also usually mean cloud cover and overcast skies and a narrower range of temperatures throughout the day because of the cloud cover. And even though the clouds reduce the daytime high temperature the higher moisture content of the air means it will be less comfortable.
Wind:
For Hawaii, and Waikoloa Village in particular, the winds typically blow from the NE to the SW, which correspond to the trade wind flow. The weather is usually nearly perfect when the trade winds are blowing because we are in the rain shadow of Mauna Kea and all the moisture in the air has been dropped on the eastern side of the island before it reaches Waikoloa Village.
When the wind stops blowing and especially if the winds come out of the west (Kona winds) for an extended period it will usually be cloudy and humid with rain more likely. This will be reflected with higher dew points. Fortunately, that doesn’t happen often here but when it does we lose the rain shadow effect and effectively become “Hilo-like” (wet). The trade winds blow more consistently in the summer than in the winter. That is good because you don’t want high humidity mixed with high summer temperatures as far as comfort goes.
Wind Run:
Wind Run is a measurement of the “amount” of air passing over a given spot during a given period of time and measured in “miles of wind”. It is calculated by multiplying the average wind speed over a given interval by the interval time. In this case, 15 minutes. It quickly gives you an indication of how “windy” it is over a longer period of time then just looking at the wind speed itself, which fluctuates rapidly.
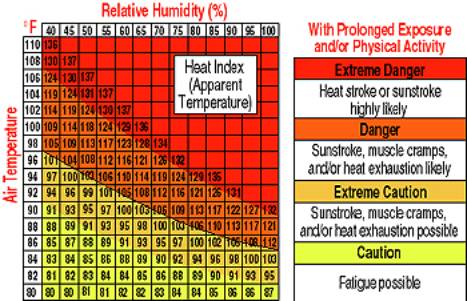
Heat Index:
The Heat Index is a calculation based upon air temperature and the relative humidity to determine how hot the air actually “feels”. When the humidity is low, the apparent temperature will be lower than the air temperature since perspiration can evaporate rapidly and cool the body. When the humidity is high the apparent temperature will “feel” higher than the air temperature because perspiration evaporates more slowly due to the high moisture content of the air. The Steadman (1979 & 1998) formula is used to calculate the Heat Index. This index does not take the wind into effect like the next two indexes attempt to do.
THSW (Temperature/Humidity/Sun/Wind) Index:
The THSW Index is a calculation based upon air temperature and relative humidity, similar to the Heat Index, but also includes the heating effects of the sun and the cooling effects of the wind to come up with an apparent temperature of what it “feels” like being out in the direct sunlight. This index usually is much higher than the air temperature and in Hawaii that should come as no surprise because you will bake if you are in the sun.
THW (Temperature/Humidity/Wind) Index:
This index is the same as the THSW Index but without the effects of direct sunlight exposure. What the air temperature “feels” like in the shade taking the wind into effect. This is probably the most useful of the three heat indexes in Hawaii because as long as you are in the shade the effective temperature taking the wind into effect is usually quit pleasant.
Solar Radiation:
Solar radiation is a measure of the intensity of the sun’s radiation reaching a horizontal surface. This irradiance includes both the direct component from the sun and the reflected component from the rest of the sky. It is expressed in Watts per Square Meter (W/m2). Clouds or haze will reduce the amount of solar radiation so this is an indicator of how “sunny” it is outside. The sensor’s range of values is 0 to 1800 W/m2. The maximum possible solar energy is derived by computing the deviation from the known solar constant (1,366 W/m2) as a function of the cosine of the sun’s elevation above the local horizon. The most intense possible radiation is always at solar noon and tapers to zero at sunrise and sunset. The maximum possible solar radiation value at noon changes from month to month (actually day to day) as the sun’s maximum elevation at noon changes during the year. Peaking in May and July when the sun passes directly overhead at our 20-degree latitude and with its lowest value (and lowest elevation) being during December.
|
Approx. Peak
Radiation at Solar Noon |
Month |
|
750 |
December |
|
800 |
January and November |
|
900 |
February and October |
|
950 |
March and September |
|
1,000 |
April and August |
|
1,100 |
May and July |
|
1,050 |
June |
The 24-hour solar radiation chart would normally present a curve looking like the positive lobe of a sine wave if no clouds are present. Any clouds will disrupt the smooth sine curve. Using the approximate peak values noted above and the general guidelines and definitions of “cloudiness” noted below you can estimate how cloudy a given day was.
|
Cloudiness |
Definition |
|
Thick Clouds |
Observed solar energy is less than 20% of the max
possible value |
|
Cloudy |
Observed solar energy is less than 50% of the max
possible value |
|
Partially Sunny |
Observed solar energy is greater than 50% but less than
75% of the max possible value |
|
Sunny |
Observed solar energy is greater than 75% of the
max possible value |
|
Dawn or Dusk |
The sun’s elevation angle is <7 degrees and most
radiation is diffuse rather than direct |
Solar Energy:
The amount of accumulated solar radiation energy over a period of time is measured in Langleys.
1 Langley = 11.622 Watt-hours/m2 = 3.687 BTUs/ft2 = 41.84 kilojoules/m2.
UV Index:
The UV Index is similar to solar radiation but measures only the intensity of the ultraviolet part of the spectrum. Exposure to UV rays contributes to various health problems such as sunburn, skin cancer, skin aging, cataracts and can suppress the immune system. It is displayed in two units: MEDs (Minimum Erythermal Dose) or UV Index. MED is defined as the amount of sunlight exposure necessary to induce a barely perceptible redness of the skin within 24 hours after sun exposure. 1 MED for light skin will be different than for people with darker skin. The UV measures do not take into account UV that can be reflected off sand or water that can significantly increase a person’s exposure.
The UV Index assigns a number between 0 and 16 to the current UV intensity. The UV Index value published by the US National Weather Service is a forecast of the next day’s noontime UV intensity.
|
Index Values |
Exposure
Category |
|
0-2 |
Low |
|
3-4 |
Moderate |
|
5-6 |
High |
|
7-9 |
Very High |
|
10+ |
Extreme |
The following are specialist type data that will probably
only be useful to auto racers, farmers, gardeners, woodworkers or building
designers and the construction industry.
Air Density:
Air Density is the weight of 1 cubic foot of air. It is calculated from absolute pressure (barometric pressure uncorrected for altitude), relative humidity and temperature. It is an indirect measure of how much oxygen is in the air so auto racing enthusiasts can use it to determine optimal carburetor jetting. It is included here more for fun than for being a useful meteorological plot.
Evapotranspiration (ET):
ET is a measurement of the amount of water vapor returned to the air in a given area. It combines the amount of water vapor returned through evaporation (from wet vegetation surfaces) with the amount of water vapor returned through transpiration (exhaling of moisture through plant skin). Temperature, relative humidity, average wind speed and solar radiation are used to estimate ET. Effectively, ET is the opposite of rainfall and is expressed in the same units (inches). The data can be useful for plant growers in determining watering needs.
Equilibrium Moisture Content (EMC):
The drying of wood before it’s commercial utilization is mainly done to reduce its shrinkage or swelling when in service. If wood is dried to a moisture content (EMC) that is in equilibrium with the environment in which it will be used then shrinkage or swelling of the wood will be minimized. EMC is derived using temperature and relative humidity.
For instance, molecules of water are constantly leaving and returning to a wood’s surface. If the same number of molecules of water return to as leave from the surface, an equilibrium condition exists. Since the wood is neither gaining nor losing water it is said to have reached an equilibrium moisture content, or EMC.
Heating and Cooling Degree-Days:
Heating degree-days are used to calculate the amount of heat necessary to keep a building comfortable for occupation. Likewise, cooling degree-days are used to estimate the amount of heat that must be removed (through air-conditioning) to keep a structure comfortable. Heating and cooling degree-days are based on departures from a base temperature, 65ºF.
One heating degree-day is the amount of heat required to keep a structure at 65ºF when the outside temperature remains one degree below the 65ºF threshold for 24 hours. One heating degree-day is also the amount of heat required to keep that structure at 65ºF when the temperature remains 24ºF below that 65º threshold for 1 hour.
Likewise, one cooling degree-day is the amount of cooling required to keep a structure at 65ºF when the outside temperature remains one degree above the 65ºF threshold for 24 hours. One cooling degree-day is also the amount of cooling required to keep that structure at 65ºF when the temperature remains 24ºF above that 65º threshold for 1 hour.
Depending on the calculation method, both heating and cooling degree-days can accumulate in the same day. Also, note that there are no negative degree-days. If the temperature remains below the threshold, there is no degree-day accumulation.